USDA Study of Cycle Stop Valves
A Pressure Regulating System for Variable Irrigation Flow Controls
H. Zhu, R. B. Sorensen, C. L. Butts, M. C. Lamb, P. D. Blankenship
Article was submitted for review in November 2001; approved for publication by the Soil & Water Division of ASAE in June 2002.
Mention of proprietary product or company is included for the reader's convenience and does not imply any endorsement or preferential treatment by the USDA-ARS.
The authors are Heping Zhu, ASAE Member Engineer, Agricultural Engineer, Ronald B. Sorensen, Agronomist, Christopher L. Butts, ASAE Member Engineer, Agricultural Engineer, Marshall C. Lamb, Agricultural Economist, Paul D. Blankenship, ASAE Member Engineer, Research Leader, USDA-ARS, National Peanut Research Laboratory, Dawson, Georgia. Corresponding author: Heping Zhu, USDA-ARS, National Peanut Research Laboratory, P.O. Box 509, Dawson, GA 31742; phone: 229-995-7459; fax: 229-995-7416; e-mail: hzhu@nprl.usda.gov. ABSTRACT. It is important for an irrigation system to have a stable constant pressure to obtain efficient water management for crops. A simple mechanical flow control system with a pressure-regulating valve was investigated for subsurface drip irrigation and small acreage sprinkler irrigation to maintain constant pressure under variable flow conditions. A submersible pump, booster pump, and centrifugal pump were tested with the control system for the variable flow rates ranging from 9.6 to 222.1 L/min and pressure ranging from 69 to 276 kPa. As long as the pumps were able to provide enough flow to maintain a pressure differential of 124 kPa between control system inlet and outlet, the line pressure remained constant and stable through the test. Standard deviation of the pressure from the flow control system at 69-kPa pressure setting was 0.4 kPa for the submersible pump, 1.2 kPa for the booster pump, and 3.9 kPa for the centrifugal pump. At the 69-kPa pressure setting, the amperage to the booster pump decreased from 11.3 to 8.8 A when the total flow rate in the line decreased from 158.1 to 41.2 L/min. The irrigation system with the flow control avoided pressure pulsation and reduced total energy consumption. Keywords. Precision flow control, Subsurface drip irrigation, Valves, Pumps.
Subsurface drip irrigation (SDI) has great potential to precisely deliver water, nutrients, and chemicals to the crop root zone. Acreage with SDI has increased considerably during the last two decades due to reliable technology, potential water resource protection, crop yield increases, and improved water conservation. A recent irrigation survey indicated that 163,957 ha of SDI has been installed in the United States, representing about 0.64% of the total irrigated area (Anonymous, 2001).
Due to declining water supplies and environmental concerns related to irrigation, SDI has been widely used for many applications throughout the world (Camp et al., 2000). In most southeastern states of the United States, SDI is initially installed on small acreage to determine its feasibility for their crops under local conditions (Camp, 1999). One of the greatest advantages of using SDI in the Southeastern United States is that the system can start easily and provide flexible irrigation scheduling between periods of rainfall. O'Brien et al. (1998) indicated that the SDI could be competitive on small farmland compared with the center pivot system. SDI offers great potential for disease prevention for certain crops (Bell et al., 1998) and to the agricultural areas with limited water supplies and the areas with water containing high salt content (Black et al., 1970).
Many field tests have been conducted using SDI in various crops to improve water usage. Some publications regarding the research on SDI technique include: Carter and Floyd (1972), Camp et al. (1988), Powell and Wright (1993), Plaut et al. (1996), Steele et al. (1996), Lamm et al. (1997), and Sorensen et al. (2001). SDI shows promise for many agricultural uses, including small farms, irregular fields, and the corners of the fields that have center pivots. These areas often require SDI to provide various flow rates with constant pressure to different irrigation zones according to zone sizes and crop types. Reaves (1999) recommended using a "hydrozoned" irrigation system that divides a landscape into many small zones based on different plant water requirements, plant height, and plant density to obtain optimal water efficiency for crops in each zone without water puddling or runoff.
Currently, the variable frequency drive (VFD) has been widely used to control pump motor speed to obtain constant pressure for variable flow rate applications. However, VFD is a by-product of obtaining electrical current at a variable fundamental frequency (Manz and Morgan, 1996). Therefore, the motor must be oversized for the application, resulting in wasted energy in the form of heat and increased costs. Also, using VFD to slow the pump speed could result in insufficient coolant flow to cool motors and pumps such as submersible pumps.
Another method for variable flow control is a multiple-pump system. This system uses a large tank to store water pumped from a well or a surface water source. Then small pumps are used to separately deliver stored water to different irrigation zones as required. This method requires pumps to frequently start and stop causing pump cycling, pressure pulsation, and possible water hammer. Excessive pump cycling creates increased electric arcing resulting in shorter pump life. Both VFD and multiple-pump system can be expensive and difficult to maintain.
Successful flow control is essential for irrigation systems to obtain high water application efficiency. To obtain optimum water application efficiency for SDI, water flow rate and pressure in the system should be controlled under variations in system application based on crop requirement. There are very few publications related to optimal flow control system design for SDI systems. Variations of flow rate among drip emitters could result in applying excessive water beyond crop water needs (Wu and Gitlin, 1983). Pressure fluctuations in the irrigation system can further reduce water application uniformity.
Valves can play a key role in proper water flow control when different hydraulic conditions are encountered. It could help lead to the best management and maintenance of irrigation systems. Simple mechanical valves to maintain constant pressure with variable flow applications are needed. The objective of this research was to evaluate and develop a pressure regulating system, tested with three types of pumps to accommodate adequate system capability to provide constant pressure for variable flows without increasing electrical consumption and pump cycling. This approach, in turn, could simplify the irrigation control system and reduce cost.
Materials And Method
A flow control system with a Model CSV3B pressure-regulating valve also called cycle stop valve (Cycle Stop Valves, Inc., Lubbock, Tex.) was installed in a small irrigation testing system (fig. 1). The inlet and outlet diameters of the valve were 5 cm with threaded NPT connections. Rated flow rate of the valve ranged from 19 to 581 L/min. The valve primarily consisted of a pressure-reducing pilot valve for downstream pressure adjustment and a single diaphragm for controlling the flow chamber size in the main valve body. The pilot valve could sense downstream pressure and modulate the diaphragm opening to maintain pressure at set point when changes in flow rate occurred downstream. The valve provided a means to reduce pump output to match the amount of water required using standard constant speed pumps instead of variable speed pumps. The valve also contained self-flushing and non-closing features that ensured a minimum amount of water flow through the pump necessary to cool the pump and motor (Austin, 1999).
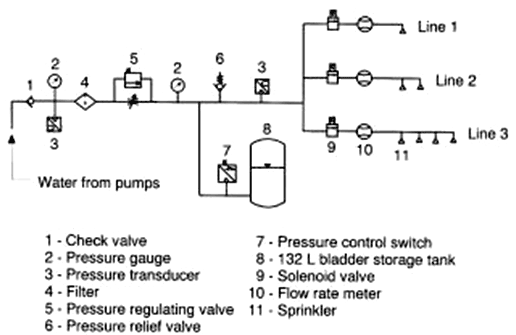
Three different pumps (a submersible, a booster type of centrifugal, and a centrifugal) were used to evaluate the performance of the flow control system with the pressure-regulating valve. The system was connected to the discharge line of each individual pump. The discharge line included a 5-cm diameter check valve (Simmons Manufacturing Co., McDonough, Ga.) and a 5-cm diameter line filter (Terra-Products, Inc., Crawfordsville, Ind.) that were installed between the pressure-regulating valve and the pump (fig. 1). The main line was 5-cm inside diameter. Two PX120 pressure transducers (OMEGA(r), Stamford, Conn.) were installed in the main flow line to measure upstream and downstream pressures of the pressure-regulating valve.
A Model FP7120 bladder storage tank (Flotec, Delavan, Wis.) was connected with a 2.6-cm I.D. tee to the main line downstream of the pressure-regulating valve. The tank was factory pre-charged with air pressure of 276 kPa and held a maximum capacity of 132 L of water. Actual air pressure in the tank for tests was always set at 34.5 kPa below the valve pressure setting point. For example, the tank was charged with air at 172.5-kPa pressure when the pressure setting point for the pressure-regulating valve was 207 kPa. A Model 69WA4 pressure switch (Siemens Energy & Automation, Inc., Batavia, Ill.) was mounted about 30 cm from the tank inlet. The start point of the pressure switch was set the same as pressure setting point on the pressure-regulating valve, and the close point was set at 138 kPa above the start point. For example, when the pressure setting on the pressure-regulating valve was 207 kPa, the start point of the pressure switch was 207 kPa and the close point was 345 kPa.
Three irrigation lines represent irrigation situations with various flow rates (fig. 1). An electric solenoid valve and a Hydro-Flow Model 1100 inline vortex flow meter (Fluidyne, Longmont, Colo.) were installed in each line to control and measure water flow rate through each line. Water flow to each line was controlled by manually operating switches for each solenoid power supply. As shown in figure 1, there was one sprinkler on Line 1, two sprinklers on Line 2, and four sprinklers on Line 3. The sprinklers were Senninger Model 4023 with No. 12 nozzles (Senninger Irrigation Inc., Orlando, Fla.). The inside diameter of the PVC pipe for Lines 1 and 2 was 2.6 cm, and 4.0 cm for Line 3. The secondary orifice of each sprinkler was blocked during all tests.
Analog signals from pressure transducers and flow meters were transferred to a portable CR23X data logger (Campbell Scientific, Inc., Logan, Utah) for data acquisition. Data were collected and stored every second into a storage module.
The submersible, Model 45EP5017, deep well pump (General Pump Manufacturing Inc., Oklahoma City, Okla.) used in the test had a 10-cm inlet diameter and 5-cm outlet diameter. The pump was driven by a single phase, 230-V, 3.7-kW motor at 3450 rpm. The rated pump capacity was 350 L/min with a total dynamic head of 91.4 m. Water was delivered from a deep well by the pump set 42.7 m below the surface.
The booster type of centrifugal pump (booster pump) was a Model 2PC22, two-stage, non-self priming Teel(r) pump (Dayton Electric Mfg. Co, Niles, Ill.) with a 3-cm discharge port and a 4-cm suction port. The suction lift had a maximum rate of 7.6 m. The pump was driven by a single phase, 230-V, 1.5-kW motor at 3450 rpm, and produced 180 L/min at 207-kPa pressure. The maximum rated pressure head of the pump was 490 kPa. Water was pumped from a 38,750-L water tank set 1 m above the pump.
The centrifugal pump used in the test was a Model 1P851, high volume liquid transfer, self-priming Teel(r) pump (Dayton Electric Mfg. Co, Niles, Ill.) with 4-cm intake and discharge ports. The pump could deliver 320 L/min of water at 138-kPa pressure. The maximum rated pressure head from the pump was 28.3 m. The pump was mounted close to the ground and was driven by a single phase, 230-V, 1.5-kW motor at 3450 rpm. Water was pumped from the same reservoir tank described earlier for the booster pump.
The performance of the flow control system was tested with each of the three pumps at various pressure settings, seven flow rates per pressure setting, and three replications per flow rate. The irrigation lines were open or closed according to the sequence listed in table 1 to create 21 discrete variations in flow. Each condition was tested for 3 min for a total of 63 min to complete the sequence, and each sequence was repeated twice. As shown in table 1, to investigate stabilities of flow rate in each line and the downstream pressure of the flow control system, each line was open consecutively for 18 min during the sequence while the other two lines were in open or closed condition. For the last 21 min of the test, three lines were randomly opened or closed to allow the system receiving random water demands from each individual line.
Table 1. Operation sequence of irrigation lines to create variable flows for the performance evaluation of the flow control system with three types of pumps.[a]
| Line 1 | • | C | C | • | • | C | C | • | • | • | • | • | • | • | C | C | C | • | • | C | C |
| Line 2 | • | • | C | C | • | • | • | • | • | • | C | C | C | • | • | • | C | C | C | C | • |
| Line 3 | • | • | • | • | • | • | C | C | • | C | C | • | C | C | C | • | • | • | C | • | C |
| Active Sprinklers_ | 7 | 6 | 4 | 5 | 7 | 6 | 2 | 3 | 7 | 3 | 1 | 5 | 1 | 3 | 2 | 6 | 4 | 5 | 1 | 4 | 2 |
| Time (min) | 3 | 6 | 9 | 12 | 15 | 18 | 21 | 24 | 27 | 30 | 33 | 36 | 39 | 42 | 45 | 48 | 51 | 54 | 57 | 60 | 63 |
[a] • represents the line was open and C represents the line was closed.
_ Total number of sprinklers in use.
The performance of the flow control system was investigated with pressure settings at 69, 138, 207 and 276 kPa for the submersible pump; 69, 138, and 207 kPa for the booster pump; and 69, 103, and 138 kPa for the centrifugal pump. Tests at 172-kPa pressure setting for the centrifugal pump were also conducted but the flow control system could not maintain stable pressure when the line had more than four sprinklers. The operating pressure for SDI usually ranges from 69 to 138 kPa. However, in some situations pressure loss is significant when water flows in long piping lines from the flow control system to the field with elevation changes. For each pressure setting, pressures upstream and downstream, the pressure-regulating valve, and flow rate through each individual irrigation line were measured for all test combinations listed in table 1.
Additional tests were conducted to determine the electric consumption by the pumps and the maximum flow rate at which the desired downstream pressure could be maintained. Removing the nozzle from one or more sprinklers in each line increased flow rate for these tests. This configuration reduced the flow resistance downstream the pressure-regulating valve, causing the valve to open larger and allowing more water to flow through the system. The tests were conducted for all three pumps and at the desired pressure settings.
The repeatability of the downstream pressure at a set point was investigated by shutting off the pump and then starting it again. The stability of pressure and flow rate was investigated by opening all three irrigation lines containing seven active sprinklers for four hours. Pressure was set at 276 kPa for the submersible pump, 207 kPa for the booster pump, and 138 kPa for the centrifugal pump. Higher pressures were used here because observations from the earlier tests showed that higher pressure settings created more fluctuation on downstream pressure than lower pressure settings. Tests were also conducted to determine if the pressure could return to the previous set point after pumps restarted.
The on/off cycle time was measured for pressure switch to shut off and start the pump. The amperage to the pump motors was measured with an amperage meter for all test conditions.
Results And Discussion
Pressure Stability
Figures 2, 3, and 4 show the response of pressure upstream and downstream to the pressure-regulating valve, along with the flow rate during the irrigation sequence listed in table 1. The sequence was for the submersible pump with the pressure setting at 276 kPa, the booster pump at 207 kPa, and centrifugal pump at 138 kPa, respectively. These pressures were the highest pressure conditions tested for three individual pumps. Generally, the flow control system maintained a stable downstream pressure within the desired flow rate range for all three pumps. The downstream pressure decreased slightly as total flow rate increased which also resulted in decreased upstream pressure.
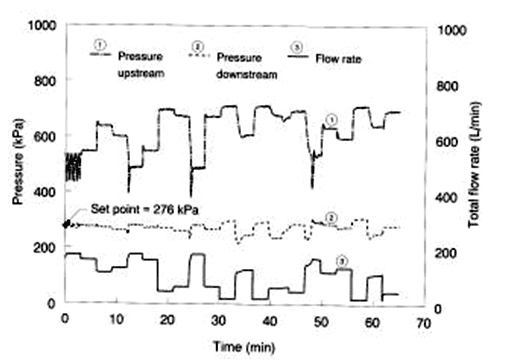
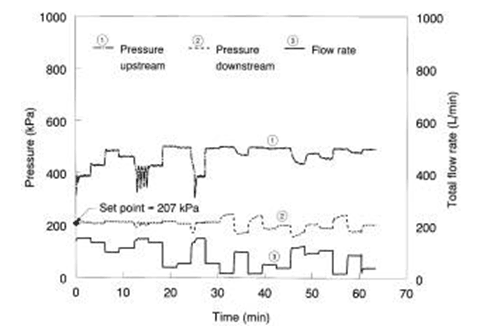
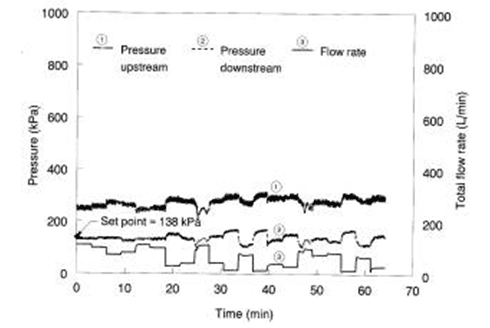
Generally, upstream and downstream pressures fluctuated more at individual pressure set points using the centrifugal pump (fig. 4) than with the other two pumps (figs. 2 and 3). Compared to the upstream pressure, the downstream pressure for all three pumps showed little variation as total flow rate fluctuated. At the 207-kPa pressure setting, when flow rate from the booster pump suddenly increased from 53.7 to 149.5 L/min, the upstream pressure decreased from 496 to 386 kPa while the downstream pressure only changed from 205 to 209 kPa (at 24 min in fig. 3). The pressure change represented a 1% variation in the downstream pressure compared to a 22% reduction in the upstream pressure at this pressure setting.
When total flow rate suddenly increased, in most cases both upstream and downstream pressures for all three pumps gradually dropped and then returned to the desired values. For the submersible pump with the pressure setting at 276 kPa, when the number of active sprinklers suddenly changed from three to seven (at 24 min in fig. 2), the flow rate increased from 61 to 175 L/min in 36 s. The upstream pressure decreased from 672 to 382 kPa in 22 s, then increased to 484 kPa in 20 s. The downstream pressure decreased from 263 to 233 kPa in 18 s, then increased to 274 kPa in 8 s, and then remained consistent.
Tables 2, 3, and 4 illustrate the influence of the valve pressure setting and number of active sprinklers on average flow rate from each sprinkler, total flow rate in main line, pressure downstream the flow control system, and electric current to the pump motor for the submersible, the booster, and the centrifugal pumps, respectively. Variations of flow rates and pressures among replications were very little. At low-pressure settings when the system contained only one to three active sprinklers, the downstream pressure for all three pumps was significantly higher than its set point due to the low total flow rate. For the submersible pump with 69-kPa pressure setting, the downstream pressure was 175, 151 and 136% greater than the desired pressure with one, two, and three active sprinklers, respectively (table 2). During the entire testing sequence with two sequence replications, the standard deviation of average downstream pressure for the submersible pump with seven active sprinklers was 0.4, 0.5, 1.4, and 5.6 kPa for the pressure settings at 69, 138, 207, and 276 kPa, respectively. Similarly, with seven active sprinklers for the booster pump, the standard deviation was 1.2, 1.3, and 5.8 kPa for the pressure settings at 69, 138, and 207 kPa. And for the centrifugal pump with seven active nozzles, the standard deviation was 3.9, 4.2, and 4.2 kPa for the pressure settings at 69, 103, and 138 kPa.
Table 2. Flow rate, pressure downstream the pressure regulating valve, and electric current to the pump motor at various pressure settings and numbers of active sprinklers for the submersible pump.
| Pressure Setting (kPa) |
No. of Active Sprinklers |
Flow Rate (L/min) |
Pressure (kPa) |
Amperage (amp) |
|
|---|---|---|---|---|---|
| Total | Average | ||||
| 69 | 1 | 10.5 | 10.5 | 120.8 | 24.00 |
| 69 | 2 | 22.3 | 11.2 | 104.7 | 23.93 |
| 69 | 3 | 30.1 | 10.0 | 94.0 | 23.77 |
| 69 | 4 | 50.7 | 12.7 | 82.1 | 24.07 |
| 69 | 5 | 56.5 | 11.3 | 76.6 | 24.20 |
| 69 | 6 | 66.5 | 11.1 | 77.0 | 23.93 |
| 69 | 7 | 72.1 | 10.3 | 74.2 | 23.97 |
| 138 | 1 | 14.4 | 14.4 | 185.8 | 24.67 |
| 138 | 2 | 31.5 | 15.8 | 151.9 | 24.77 |
| 138 | 3 | 43.4 | 14.5 | 145.4 | 25.10 |
| 138 | 4 | 75.6 | 18.9 | 140.7 | 25.83 |
| 138 | 5 | 85.6 | 17.1 | 135.4 | 26.13 |
| 138 | 6 | 104.6 | 17.4 | 138.1 | 26.63 |
| 138 | 7 | 115.2 | 16.5 | 135.5 | 26.70 |
| 207 | 1 | 17.3 | 17.3 | 247.3 | 24.57 |
| 207 | 2 | 38.8 | 19.4 | 215.0 | 25.00 |
| 207 | 3 | 53.2 | 17.7 | 205.1 | 25.07 |
| 207 | 4 | 96.5 | 24.1 | 211.7 | 26.47 |
| 207 | 5 | 109.8 | 22.0 | 204.6 | 26.67 |
| 207 | 6 | 133.4 | 22.2 | 208.0 | 26.40 |
| 207 | 7 | 147.2 | 21.0 | 203.4 | 26.03 |
| 276 | 1 | 19.4 | 19.4 | 298.8 | 27.57 |
| 276 | 2 | 44.7 | 22.4 | 280.3 | 28.30 |
| 276 | 3 | 60.8 | 20.3 | 260.3 | 28.73 |
| 276 | 4 | 110.5 | 27.6 | 270.5 | 30.30 |
| 276 | 5 | 125.4 | 25.1 | 259.1 | 30.57 |
| 276 | 6 | 155.0 | 25.8 | 274.1 | 30.67 |
| 276 | 7 | 174.9 | 25.0 | 278.0 | 30.73 |
Table 3. Flow rate, pressure downstream the pressure regulating valve, and electric current to the pump motor at various pressure settings and numbers of active sprinklers for the booster pump.
| Pressure Setting (kPa) |
No. of Active Sprinklers |
Flow Rate (L/min) |
Pressure (kPa) |
Amperage (amp) |
|
|---|---|---|---|---|---|
| Total | Average | ||||
| 69 | 1 | 9.8 | 9.8 | 103.8 | 8.18 |
| 69 | 2 | 20.0 | 10.0 | 89.1 | 8.29 |
| 69 | 3 | 25.7 | 8.6 | 74.0 | 8.35 |
| 69 | 4 | 41.6 | 10.4 | 63.2 | 8.43 |
| 69 | 5 | 49.7 | 9.9 | 63.7 | 8.56 |
| 69 | 6 | 61.7 | 10.3 | 69.2 | 8.80 |
| 69 | 7 | 63.1 | 9.0 | 61.6 | 9.01 |
| 138 | 1 | 14.0 | 14.0 | 172.6 | 8.23 |
| 138 | 2 | 28.9 | 14.5 | 142.1 | 8.33 |
| 138 | 3 | 41.1 | 13.7 | 138.9 | 8.62 |
| 138 | 4 | 73.0 | 18.3 | 133.9 | 8.97 |
| 138 | 5 | 81.6 | 16.3 | 124.9 | 9.28 |
| 138 | 6 | 103.5 | 17.3 | 138.2 | 9.65 |
| 138 | 7 | 109.4 | 15.6 | 126.9 | 10.05 |
| 207 | 1 | 16.6 | 16.6 | 234.4 | 8.32 |
| 207 | 2 | 38.2 | 19.1 | 206.1 | 8.69 |
| 207 | 3 | 53.1 | 17.7 | 201.7 | 9.03 |
| 207 | 4 | 94.8 | 23.7 | 208.2 | 9.43 |
| 207 | 5 | 107.7 | 21.5 | 198.8 | 9.80 |
| 207 | 6 | 132.5 | 22.1 | 205.7 | 10.32 |
| 207 | 7 | 146.7 | 21.0 | 204.1 | 10.88 |
Table 4. Flow rate, pressure downstream the pressure regulating valve, and electric current to the pump motor at various pressure settings and numbers of active sprinklers for the centrifugal pump.
| Pressure Setting (kPa) |
No. of Active Sprinklers |
Flow Rate (L/min) |
Pressure (kPa) |
Amperage (amp) |
|
|---|---|---|---|---|---|
| Total | Average | ||||
| 69 | 1 | 9.6 | 9.6 | 100.9 | 8.00 |
| 69 | 2 | 19.3 | 9.7 | 83.6 | 8.00 |
| 69 | 3 | 26.8 | 8.9 | 78.4 | 8.06 |
| 69 | 4 | 43.4 | 10.9 | 67.1 | 8.08 |
| 69 | 5 | 47.8 | 9.6 | 61.6 | 8.11 |
| 69 | 6 | 56.1 | 9.4 | 61.6 | 8.17 |
| 69 | 7 | 62.6 | 8.9 | 60.0 | 8.23 |
| 103 | 1 | 11.9 | 11.9 | 137.3 | 8.01 |
| 103 | 2 | 25.3 | 12.7 | 115.3 | 8.08 |
| 103 | 3 | 35.3 | 11.8 | 110.0 | 8.13 |
| 103 | 4 | 59.5 | 14.9 | 100.7 | 8.18 |
| 103 | 5 | 65.2 | 13.0 | 92.2 | 8.27 |
| 103 | 6 | 78.4 | 13.1 | 93.3 | 8.35 |
| 103 | 7 | 86.0 | 12.3 | 90.4 | 8.40 |
| 138 | 1 | 13.4 | 13.4 | 163.4 | 7.97 |
| 138 | 2 | 29.3 | 14.7 | 149.1 | 8.10 |
| 138 | 3 | 39.8 | 13.3 | 135.3 | 8.17 |
| 138 | 4 | 70.0 | 17.5 | 129.5 | 8.30 |
| 138 | 5 | 77.5 | 15.5 | 120.4 | 8.33 |
| 138 | 6 | 97.0 | 16.2 | 129.6 | 8.47 |
| 138 | 7 | 108.4 | 15.5 | 130.2 | 8.60 |
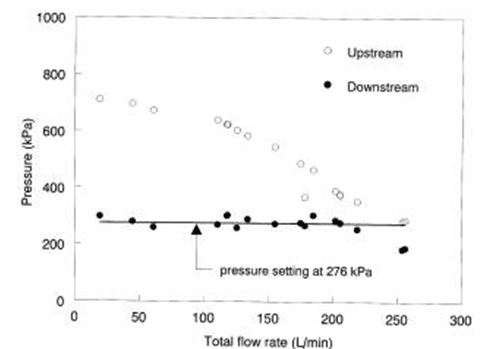
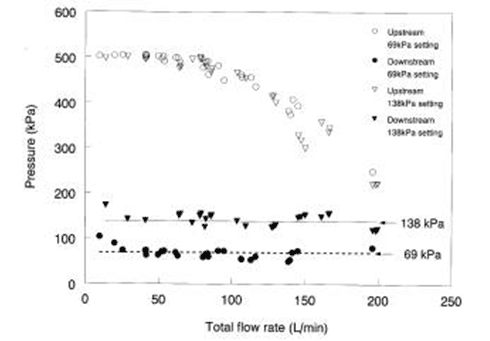
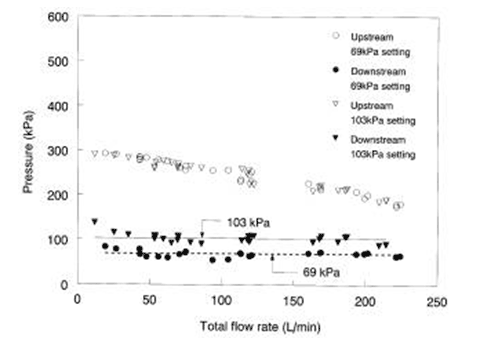
Pressure stability varied with the total flow rate. Once the total flow rate exceeded the point where the difference between the upstream and downstream pressures was less than 124 kPa, or where the total flow rate was below 26.5 L/min, the pressure-regulating valve could not maintain the set pressure. Figures 5, 6, and 7 show the response of upstream and downstream pressures to the change in total flow rate for the submersible pump at 276-kPa pressure setting, the booster pump at 69- and 138-kPa pressure settings, and centrifugal pump at 69- and 103-kPa pressure settings, respectively. For the submersible pump at 276-kPa pressure setting on the outlet of the valve, the downstream pressure remained very close to the set pressure for the total flow rate ranged from 44.7 to 218.9 L/min (fig. 5). Similarly, for the booster pump, the total flow rate range (from 41.1 to 196.0 L/min for 69 kPa and from 28.9 to 166.5 L/min for 138 kPa) had stable downstream pressures (fig. 6). And for the centrifugal pump, the flow rate range (from 43.1 to 224.0 L/min for 69 kPa and from 35.3 to 187 L/min for 103 kPa) also exhibited stable downstream pressures (fig. 7). Therefore, to select a proper flow control system with a pressure-regulating valve, the flow rate range and the pump discharge head should be considered to obtain stable pressure in the irrigation system. The upstream pressure for all three pumps followed standard pump performance curves that show that pressure decreases as total flow rate increases regardless of pressure settings on the output of the pressure-regulating valve. To select a proper pump for an irrigation system containing a flow control system with a CBV3B pressure-regulating valve, 124-kPa pressure should be added to the total dynamic head rating to obtain desired flow rate and pressure.
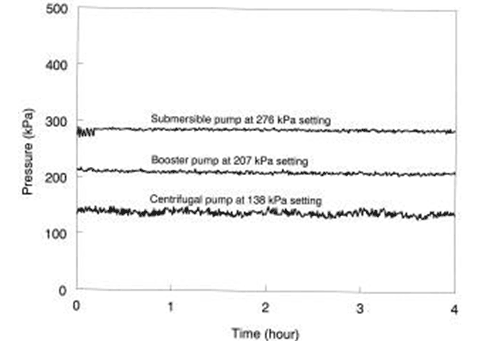
Downstream pressure in the flow control system had little variation except for low and high flow rate situations. For long-term service at one flow rate and one pressure setting, the downstream pressure was stable. Figure 8 shows the downstream pressure of the flow control system for three pumps operated for 4 h. The standard deviation of the downstream pressure during the four hours operation was 2.5 kPa for the submersible pump at 276-kPa pressure setting, 1.9 kPa for the booster pump at 207-kPa pressure setting, and 4.6 kPa for the centrifugal pump at 138-kPa pressure setting.
Electrical Consumption
Data in tables 2, 3, and 4 shows that all three pumps in most cases consumed more electrical current as the total flow rate increased. Electrical current requirements slightly increased for the submersible and booster pumps as the downstream pressure decreased (tables 2 and 3). For example, at the 207-kPa pressure setting the current to the booster pump motor increased 30.8% when total flow rate increased from 16.6 to 146.7 L/min (table 3). At the same time the downstream pressure dropped 30 kPa. For the same pump, the current was 9.80 A at 207-kPa pressure setting when total flow rate was 107.7 L/min, and was 10.05 A at 138-kPa pressure setting when the total flow rate was 109.4 L/min.
Compared to the other two pumps, the centrifugal pump had a little increase in electric current as flow rate increased for all three pressure settings (table 4). The same trends occurred with high flow rate in the additional tests that some sprinkle nozzles were removed. In this test, the amperage required by the centrifugal pump increased from 8.27 to 9.37 A when the total flow rate increased from 53.6 to 212.6 L/min at 103-kPa pressure setting, and from 8.13 to 9.43 A when the total flow rate increased from 43.0 to 222.1 L/min at 69 kPa. Conversely, the amperage required by the booster pump increased from 9.20 to 12.20 A (32.6% increase) when the total flow rate increased from 64.5 to 197.9 L/min at 138 kPa, and from 8.80 to 11.30 amp (28.4% increase) when the total flow rate increased from 41.2 to 158.1 L/min at 69 kPa.
Electric current was reduced when less flow was used resulting in less power consumption. For example, an irrigation zone in a large field is 0.5 ha and demands 10-mm depth water coverage. It actually requires 9.65-A electric current for the booster pump to deliver 103.5 L/min of water at 138 kPa for 8 h when the flow control system is installed in the irrigation line (table 3). However, the booster pump tested in this article requires 12.5 A with a single-phase 230-V power supply for its normal operation without the flow control system. Such a difference results in 5.24-kWh electricity saving during 8-h irrigation for the 0.5-ha zone if the extra water is discharged to the bypass line. Therefore, the flow control system with the pressure-regulating valve is able to save energy for the irrigation system that requires variable flow rates.
Pressure Pulsation
For a conventional pumping system there are problems associated with pressure pulsation and water hammer after a pump starts and shuts off. However, with the flow control system containing the pressure-regulating valve, the bladder storage tank absorbed the pulsation and water hammer. Figure 9 shows the response of upstream and downstream pressures when all three irrigation lines opened and closed to automatically start and shut off the submersible pump with the valve pressure setting at 207 kPa. After sprinklers in three lines were suddenly shut off (point A, fig. 9), total flow rate to the three lines dropped to zero, but a small amount of water continued to flow past the valve to fill the pressure tank and to slowly raise the system pressure. At the same time, the upstream pressure rapidly increased to 720 kPa while the downstream pressure gradually increased to 346 kPa that was the pressure switch off setting (point B, fig. 9). Then the pressure switch shut off the pump immediately. The pressure on the outlet of the pump dropped to zero while the upstream pressure dropped to 346 kPa due to a one-way check valve that was installed before the upstream pressure sensor. It took 91 s for the down stream pressure to reach 346 kPa to automatically shut off the pump after all irrigation lines were closed.
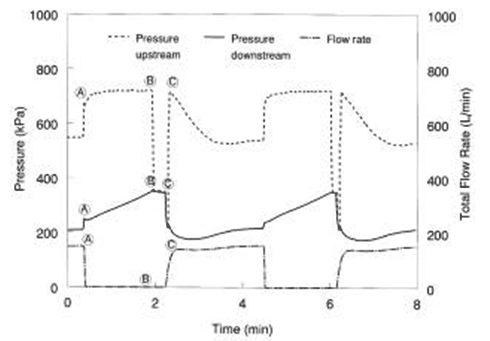
When irrigation lines were turned on (point C, fig. 9), water in the storage tank flowed into the line, and both upstream and downstream pressures dropped to 207 kPa in 5 s and then the pressure switch started the pump. After the pump started, the downstream pressure continuously decreased for 36 s and then gradually increased to the valve pressure setting point of 207 kPa. It took 87 s for the downstream pressure to reach 207 kPa after the pump started.
Since the main line was full of pressurized water and was also connected to the storage tank when the pump started or shut off, the pressure pulsation or water hammer were avoided. Similar to the results obtained with the submersible pump, the pressure pulsation in the main line was not found during tests with the booster pump and centrifugal pump at different pressure settings. The fast reaction of the flow control system eliminated pressure switch bounce and avoided pump cycling and should increase pump life and save electricity.
The automatic time control was not required for pumps to start or stop with using the bladder storage tank and pressure switch in the flow control system. Pump motor wires were connected to the power supply line directly without passing an electrical control box with a timer. With the flow control system, users could turn valves for different irrigation zones on or off at any time according to the irrigation schedule without turning the pump on or off manually.
High frequency irrigation is recommended for SDI to obtain high water use efficiency to transport water directly to the root zone by the capillary forces (Phene, 1999). The flow control system with a pressure-regulating valve would be more useful to have sequence control water into different size plots with the high frequency irrigation. It is common to subdivide large fields into smaller irrigation zones for different irrigation schedules so that smaller capacity wells can be used to irrigate variable crop species or patterns.
As the result of these tests, two flow control systems with different size pressure-regulating valves were installed in two irrigation systems in Shellman, Georgia in 2001. A 7.6-cm diameter valve was connected to a 15.2-cm diameter submersible pump to control water flow to a subsurface drip irrigation system. Another valve with a 5-cm diameter inlet and outlet was installed to control a sprinkler irrigation system. The 4-ha SDI system was used to irrigate peanut, corn, soybean, and cotton crops, each requiring different irrigation schedules and water demands. The sprinkler irrigation system covered 1 ha and consisted of containing four lines of sprinklers. Each line had five Senninger Model 4023 sprinklers with No. 12 nozzles. The flow control systems operated satisfactorily throughout the 2001 growing season and maintained 86-kPa line pressure for the SDI system and 276 kPa for the sprinkler system.
Conclusion
Based on tests with the flow control system containing a pressure-regulating valve and a small bladder storage tank for three different types of pump at various pressure settings, the following conclusions are evident.
- The flow control system provided stable pressure output for the irrigation systems with variable flows within the proper flow rate ranges of the submersible pump, booster pump, and centrifugal pump without using VFD controls and huge tanks for the multiple pump system. The system could be used for the flow control for SDI and small acreage sprinkler irrigation where the flow rate requirement was within the range that the pressure-regulating valve was able to provide.
- Design of a pumping system with a pressure-regulating valve to obtain constant pressure required at least 124-kPa to be added to the pressure normally used to select a pump from the pump performance curve, and minimum flow rate from the pump was 26.5 L/min.
- Downstream pressure and upstream pressure had slight influence on the electric current for all three pumps. Amperage required by the booster pump decreased 32.6% when flow rate decreased from 197.9 to 64.5 L/min at 138 kPa.
- With the 310-L bladder storage tank and a pressure switch in the flow control system to control the pump, an electrical control box containing a timer was not needed for the irrigation control system. The pump motor could be directly connected to the power supply line. Desired variable flow to different irrigation zones could be provided at anytime simply by opening the on-off valves as required.
- The problems associated with the pressure pulsation, water hammer and pump cycling that normally occurs in the irrigation systems were avoided due to a small bladder storage tank was used in the flow control system.
Acknowledgements
The authors thank Larry Powell and Manuel Hall for their technical assistance during experiments. Authors also appreciate Mrs. Karen Austin from Cycle Stop Valves, Inc. for her valuable advice for the test set up and providing the valve samples for the tests.
References
Anonymous. 2001. 2000 Annual irrigation survey. Irrigation J. 51 (1): 12-41.
Austin, C. M. 1999. Method and apparatus for liquid control system having a valve with a notch in the seal for enabling a sufficient fluid to pass through when the seal is fully closed to cool the pump and/or motor. U.S. Patent No. 5988984.
Bell, A. A., L. Liu, B. Reidy, R. M. Davis and K. V. Subbarao. 1998. Mechanisms of subsurface drip irrigation mediated suppression of lettuce drop caused by Sclerotinia minor. Phytopathology 88(3): 252 259.
Black, J. D. F., F. V. Garzoli, and J. W. Packard. 1970. Potential of trickle irrigation. Australian Journal of Agriculture 68(6): 165-167.
Camp, C. R. 1999. Subsurface drip irrigation Part II: SDI in the Southeast? Irrigation J. 49(3): 13.
Camp, C. R., F. R. Lamm, R. G. Evans, and C. J. Phene. 2000. Subsurface drip irrigation - past, present, and future. Proceedings of the 4th Decennial National Irrigation Symposium, ed. R. G. Evans, B. L. Benham, and T. P. Trooien, 363-372. St. Joseph, Mich.: ASAE.
Camp, C. R., G. D. Christenbury, and C. W. Doty.1988. Scheduling irrigation for corn and soybean in the southeastern coastal plain. Transactions of the ASAE 31(2): 513-518.
Carter, C. E., and J. M. Floyd. 1972. Subsurface drainage and irrigation for sugarcane. ASAE Paper No. SWR 72303. St. Joseph, Mich.: ASAE.
Lamm, F. R., C. A. Storlie, and D. J. Pitts. 1997. Revision of EP-458: field evaluation of microirrigation systems. ASAE Paper No. 972070. St. Joseph, Mich.: ASAE.
Manz, L. B., and R. B. Morgan. 1996. Mating new variable frequency drives to existing motors. Electrical Construction & Maintenance95(3): 36-38, 41-46.
O'Brien, D. M., D. H. Rogers, F. R. Lamm, and G. A. Clark. 1998. An economic comparison of subsurface drip and center pivot sprinkler irrigation systems. Applied Engineering in Agriculture 14(4): 391-398.
Phene, C. J. 1999. Subsurface drip irrigation Part I: Why and how? Irrigation J. 49 (3): 8-10.
Plaut, Z., A. Carmi, and A. Grava.1996. Cotton root and shoot responses to subsurface drip irrigation and partial wetting of the upper soil profile. Irrigation Science16(3): 107-113.
Powell, N. L. and F. S. Wright. 1993. Grain yield of subsurface microirrigated corn as affected by irrigation line spacing. Agron. J. 85 (6): 1164-1170.
Reaves, R. E. 1999. Hydrozoning is focal point of efficient irrigation systems. Irrigation Business & Technology. Nov. 1999 On-Line Edition. http://www.irrigation.org/ibt/ibt11%5F99/- p30.html. Accessed 16 Aug. 2001.
Steele, D. D., R. G. Greenland, and B. L. Gregor. 1996. Subsurface drip irrigation systems for specialty crop production in North Dakota. Applied Engineering in Agriculture 12(6): 671-679.
Sorensen, R. B., F. S. Wright, and C. L. Butts. 2001. Pod yield kernel size distribution of peanut produced using subsurface drip irrigation. Applied Engineering in Agriculture 17(2): 165-169.
Wu, I. -P. and H. M. Gitlin. 1983. Drip irrigation application efficiency and schedules. ASAE Paper No. 832078.
